
Show Wellbore Schematic
Interactive Well Site
The Wellbore Schematic button allows users to view a schematic of the Wellbore for the currently selected date.
The Wellbore Schematic button is located in the bar down the left side of the window.
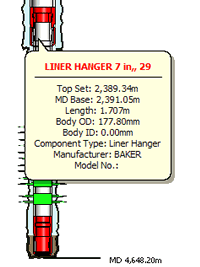
The Wellbore schematic serves as an effective QA tool, as data entered in the application is displayed as it would appear downhole.
The Wellbore Schematic also includes tool tips, zooming and one-click navigation to components data entry area.
To learn more about data used in the Wellbore Schematic see the Fields used to draw the Wellbore Schematic topic.
To view a schematic of the Wellbore, click on the Wellbore Schematic button.
The schematic for the current day is displayed in a dialog.
Notes:
The schematic in OpenWells software displays the status of the Well at the end of the reporting period. For example, if a drillstring is run and pulled within the reporting date it will not appear in the schematic for that report date.
If no schematic data exists on the current day, the following message displays: "No data exists to generate a wellbore schematic on the current date."
To view the details of a component in the schematic, hover the mouse over the component until a tool tip appears.
To increase the size of the schematic, right-click on the schematic and select Zoom-in from the menu that appears.
For better viewing click and drag the enlarged schematic to the appropriate area within the pane.
To return the schematic to its default size, right-click on the schematic again and select Zoom-out from the menu that appears.
To navigate to the data entry area of a component, double-click on the component.
The Wellbore Schematic dialog closes and the data entry area for the component opens.
To close the Wellbore Schematic dialog, click the Close button.