Features
This functionality serves as an effective QA tool as data entered in OpenWells® software is displayed as it would downhole.
Features included in the Wellbore Schematic Display enhancement include anchoring, tool tip display, and easy navigation of the schematic.
How to use OpenWells Wellbore Schematic Display Enhancement
Open a report.
On the upper left hand area above the section list the Wellbore Schematic button ![]() appears.
appears.
Click on the Wellbore Schematic button, the schematic for the selected day is displayed on the left hand side of the data entry form window.
Note: The schematic in OpenWells software displays the status of the Well at the end of the reporting period. For example, if a drillstring is run and pulled within the reporting date it will not appear in the schematic for that report date.
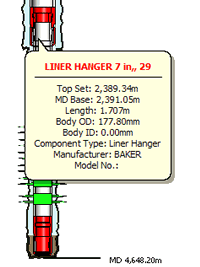
To view the details of the components in the schematic, hover the mouse over a component until a tool tip appears.

Note: to increase the size of the schematic, right-click and select Zoom-in. To return the schematic to its default size, right-click again and select Zoom-out. Also, for better viewing you may "drag" the enlarged schematic to the appropriate area within the pane.
Double-click on a component in the schematic. OpenWells software navigates to the section containing the data or switches to another report where the data resides.
If the data for the component was added outside of the current event, the following message displays:

Click "yes" to view this data.
The schematic "anchors" ![]() to the initial/current report date. To view the schematic for the "new" report date, click on the anchor
to the initial/current report date. To view the schematic for the "new" report date, click on the anchor ![]() button and the schematic regenerates the image for the "new" report date. If at any time you wish to view the schematic for a report you are currently viewing, click on the anchor button again to "un-anchor".
button and the schematic regenerates the image for the "new" report date. If at any time you wish to view the schematic for a report you are currently viewing, click on the anchor button again to "un-anchor".
With the schematic anchored you can move to different reports and edit data that will impact the schematic.
For example, on the 20th day of operations it is noticed that the casing string from the previous section has an incorrect setting depth. The schematic diagram can be anchored to the 20th day of operations, and a user can move to the casing report with the inaccurate depth recorded and correct the data. The correction will update the anchored schematic with the correct data.
To learn more about data used in the Wellbore Schematic see the Fields used to draw the Wellbore Schematic topic.