Land
Offshore
Today's Wells
OpenWell's Features
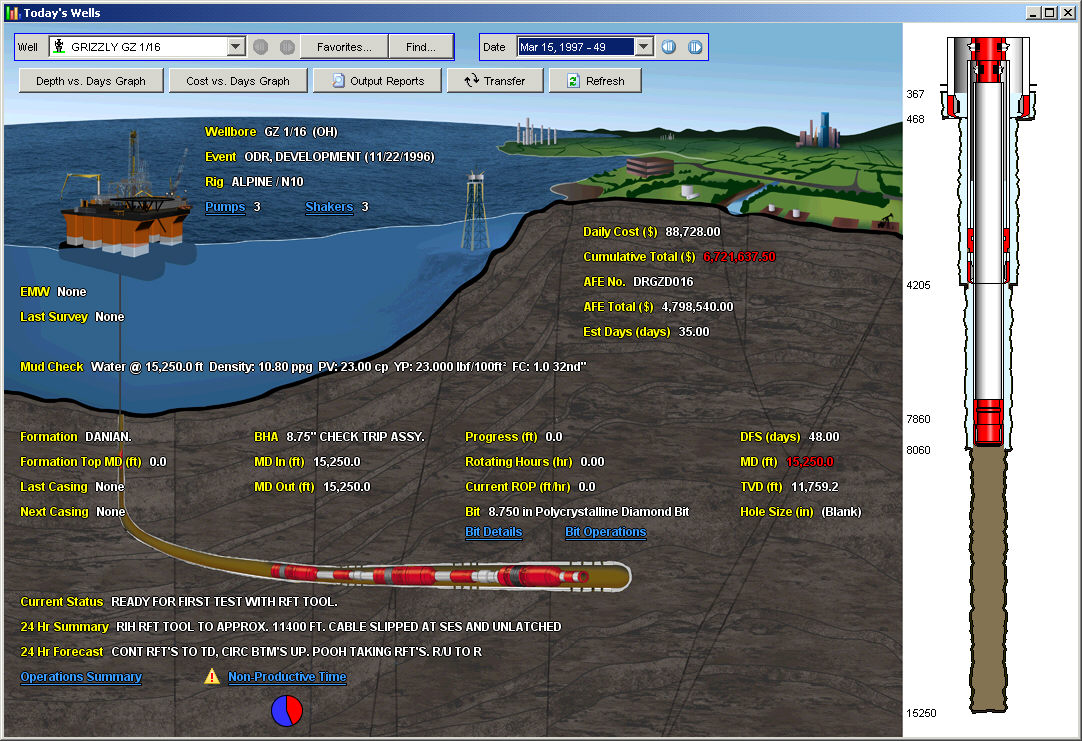
The Today's Wells feature allows users to quickly determine the status of a Well, without navigating through the Well Explorer tree, Daily Reports and printed Morning Reports. This feature displays a pictorial representation of a Well along with pertinent data on the operation state of the Well for a given day. From this dialog the user can:
review the daily status of Wells and Daily reports across multiple Events,
create a list of "Favorite Wells" available each time the Today's Wells dialog is opened,
navigate to the data entry area for the following items using the blue hyper link: Pump Operations, Shaker Operations, Bit Details, Bit Operations, Surveys, Operations Summary, NPT and Safety incidents,
identify costs that are over the AFE and depths that are under planned,
view a schematic of the Well,
view a Depth vs Days or Cost vs Days graphs,
launch available Output reports for the Well,
navigate to other report days across numerous Events.
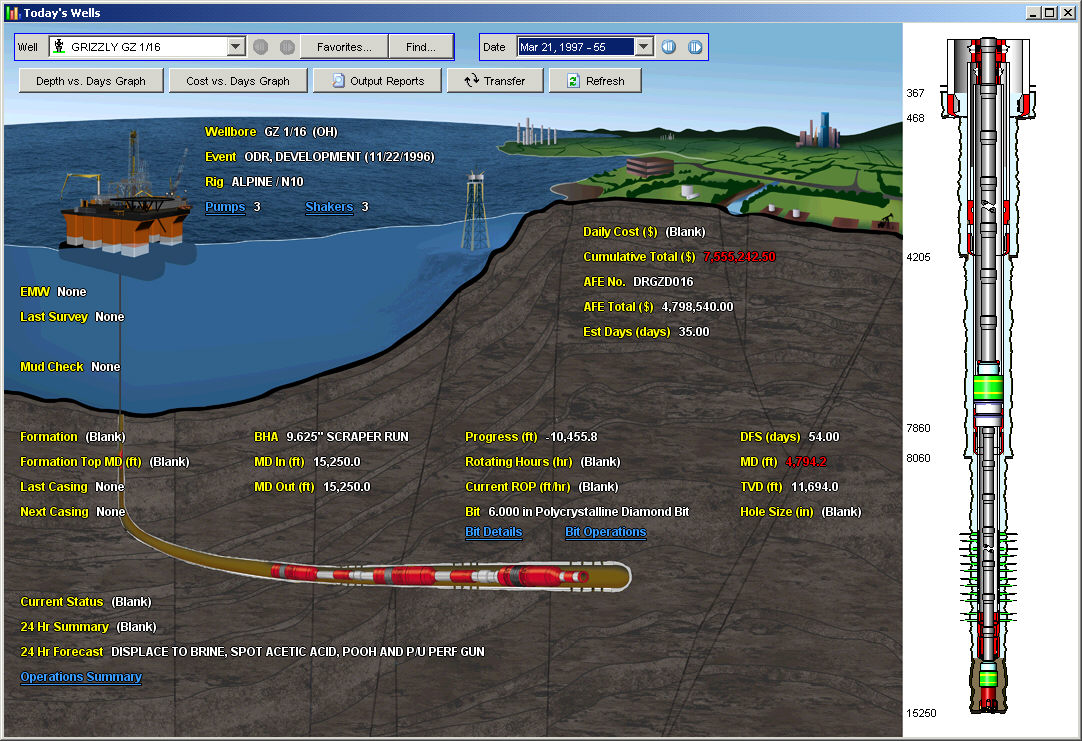
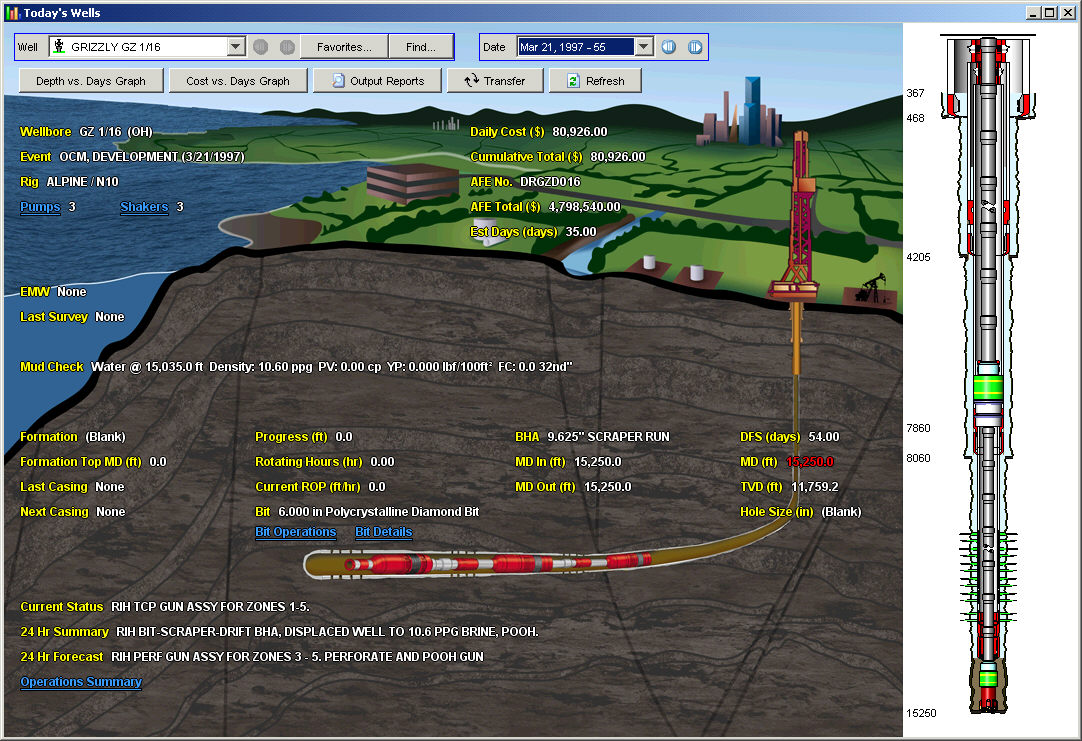
Today's Wells displays a picture of a Land Rig or an Offshore Rig, based on the configuration of the Reference Datum Level of the Well.
Land |
Offshore |
|
|
Special Features and Functionality
![]()
The Well picklist allows users to select a Well to view its operations status. This picklist is made up from a listing of "Favorite" Wells created by the user.
When the Today's Wells dialog is opened the Well currently selected in the Well Explorer tree, appears in this list.
Note: If no Well is selected at the time the Today's Wells dialog is opened, then you must select a Well from the list of Favorites or add a Well to the list of Favorites.
To select a Well
and view its current status, click the ![]() button.
The Select Well dialog
appears.
button.
The Select Well dialog
appears.
Select the Company, Project, Site and then the Well to viewed.
If you are not sure
where the Well is located, click the ![]() button.
button.
Enter the name (or partial name) of the Well in the Well name field and click the Find button.
A listing of Wells
matching your search criteria is displayed. Select the Well you
are looking for and click OK.
For information on Finding a Well, see the Find
Well Dialog topic.
Click OK.
To add Wells to
the Favorites list, click the ![]() button. The Manage Favorite
Wells dialog appears.
button. The Manage Favorite
Wells dialog appears.
Click the ![]() button, to add the Well to the Favorites list. This Well is now
available from the list each time Today's Wells is opened.
button, to add the Well to the Favorites list. This Well is now
available from the list each time Today's Wells is opened.
To add another Well
to the Favorites list, click the ![]() button.
button.
Select the Company, Project, Site and Well to be added to the Favorites list.
If you are not sure
where the Well is located, click the ![]() button.
button.
Enter the name (or partial name) of the Well in the Well name field and click the Find button.
A listing of Wells matching your search criteria is displayed. Select the Well you are looking for and click OK.
Click OK.
The Well is added to the Favorites list and available for selection each time the Today's Wells dialog is opened.
Use the ![]() and
and ![]() buttons to navigate through the
list of Favorite Wells.
buttons to navigate through the
list of Favorite Wells.
![]()
The Date picklist allows the user select a date for which they want to view the Well's operation status.
Use the ![]() and
and ![]() buttons to navigate through the
report dates chronologically across the life cycle of the Well.
buttons to navigate through the
report dates chronologically across the life cycle of the Well.
Graphs
The ![]() button displays a Depth vs. Days Graph across the Event. This graph displays
the planned and actual Measured Depth vs Days from Spud or Measured Depth
vs Days on Location. The following fields are used to draw these graphs:
button displays a Depth vs. Days Graph across the Event. This graph displays
the planned and actual Measured Depth vs Days from Spud or Measured Depth
vs Days on Location. The following fields are used to draw these graphs:
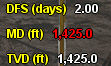
Actual: MD, Days on Location and Days from Spud are taken from the Daily Operations report, General section: MD, DOL and DFS fields.
Planned: MD and Duration is taken from the Well Planning report, Planned Operations section, MD To and Target Duration (converted to days) fields.
The ![]() button
displays a Cost vs. Days Graph across the Event. This graph can display
Cumulative Cost vs Days from Spud or Cumulative Cost vs Days on
Location. The following fields are used to draw these graphs:
button
displays a Cost vs. Days Graph across the Event. This graph can display
Cumulative Cost vs Days from Spud or Cumulative Cost vs Days on
Location. The following fields are used to draw these graphs:
Actual: Cumulative Total, Days on Location and Days from Spud are taken from the Daily Operations report, General section: Cumulative Total, DOL and DFS fields.
Planned: MD and Duration is taken from the Well Planning report, Hole Plan section, Target Duration (converted to days) and Target Cost fields.
Output Reports
The ![]() button allows users to view a number of Well related Output Reports, such
as, the Daily Drilling Report or the Daily Cost Report.
button allows users to view a number of Well related Output Reports, such
as, the Daily Drilling Report or the Daily Cost Report.
Linked Data
Click on one of the Blue underlined links to navigate to the area where the data was entered. For example, click on the Pumps link opens the Pump Operations section of the Daily Operations report where the pump operations were entered.
A link is available for each type of Rig Equipment, the Bit and Survey data.
Actual exceeds Planned data
The Cumulative Cost appears in red, if it exceeds the AFE Total.
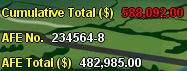
The Daily MD appears in red if the MD for that day is below the planned MD for that day. OpenWells® software compares the MD current and Days on Location in the Daily report with the MD To and Target Duration in the Well Planning report, Planned Operations section, MD To and Target Duration.
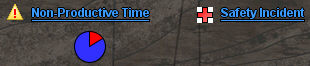
Non-productive Time (NPT) and Safety Incidents
If a NPT incident has been
recorded the ![]() icon appears
on the Today's Wells dialog, click the Non-Productive
Time link to view the NPT. A pie chart representing downtime is
also displayed.
icon appears
on the Today's Wells dialog, click the Non-Productive
Time link to view the NPT. A pie chart representing downtime is
also displayed.
Likewise, if a Safety incident
has been recorded the ![]() icon appears on the
Today's Wells dialog, click the Safety
Incident link to view the Safety incident.
icon appears on the
Today's Wells dialog, click the Safety
Incident link to view the Safety incident.
Wellbore Schematic
The area to the right of the picture displays a schematic of the Wellbore associated with the selected Report date. To generate a schematic click anywhere in the white area.